Regularized linear models, and spectral clustering with eigenvalue decomposition
Implemented linear, ridge, and lasso regression on quantitative data. Performed spectral clustering on graphical data.
1. Pre-processing
Cleaned the quantitative data and set up everything in the format:
For the further explanation, we represent as
2. Linear regression
Result: 
3. Ridge regression
Through ridge regression, the linear regression’s RHS is L2-regularized as
Result: 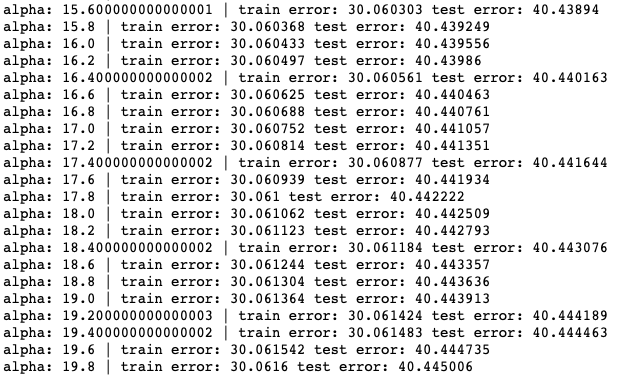
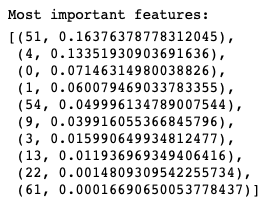
4. Lasso regression
Through ridge regression, the linear regression’s RHS is L1-regularized as
Result: The top features are as follows
5. Degree and laplacian matrix
Firstly, the graph dataset is represented in the Adjacency Matrix format, i.e., if node 1 is connected to node 2, , else,
Next, the degree matrix is computed. It is defined as the diagonal matrix corresponding to the graph that has the vertex
in the
position.
The Laplacian matrix is calculated as .
Result: 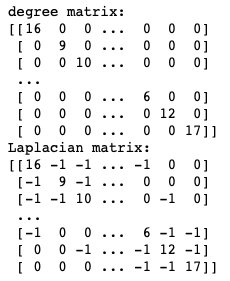
6. Eigenvector and eigenvalue computation
The eigenvectors and eigenvalues of are calculated, and the top
eigenvalues are identified.
Result: 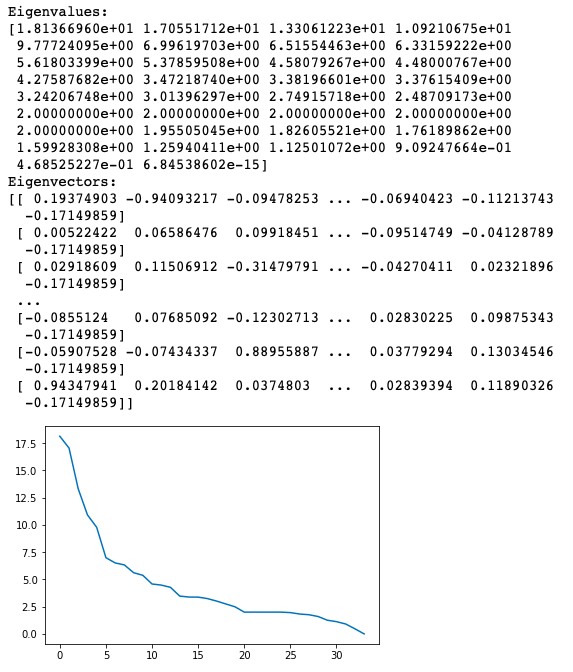
7. Spectral clustering
K-means is run on to recover the actual
Result: 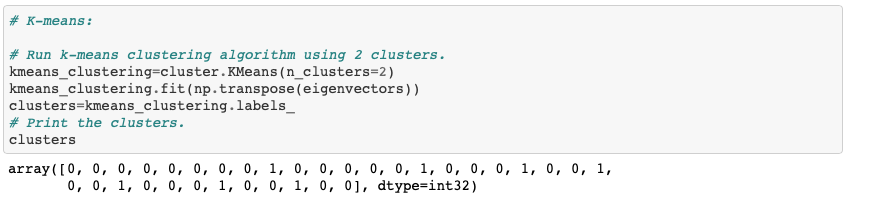
Check out the code here.