Analysis of co-purchased products on Amazon
Large sized graphs are difficult to visualize, as they are computationally very expensive to plot. In such cases, we have to rely on algorithms which help us identify various communities and clusters in the graph, which are difficult to visualize too.
The motivation behind this project was to study the methodology behind how product recommender systems provide relevant product recommendations to users. Most of the Machine Learning methods possess a naïve assumption of falling in a distribution, and it is not possible to use such methods for graph-based recommender systems, where there may be no distribution which can accurately represent the dataset.
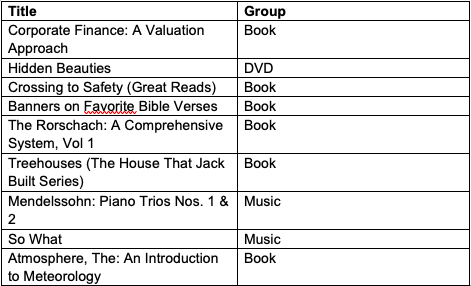
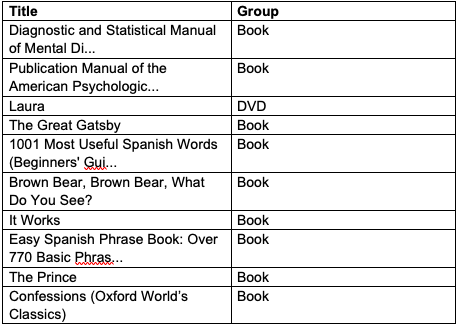
The dataset, “Amazon co-purchased products” possesses of the following attributes:
- Product
- Group (Book, Video, DVD, Music)
- Sales Rank
- Similar products (at most 5 products which are similar to the product)
- Similar categories
- Reviews
- Avg. Rating
As there is no objective ground truth for this problem, due to the scale of the data-points, which cannot be categorized by humans. Therefore, the project was to attempt to evaluate identify communities, and try to evaluate them.
Prior work
Dimensionality reduction is a major area of research in graph theory, and various methods are used to conduct the same. There are trade-offs when it comes to reducing dimensions, but in many cases, the approximations too give quite good results, close to the reality.
The project included usage of Laplacian Matrix to calculate Eigenvalues and Eigenvectors1 of the graph, and use them to estimate the optimal number of eigenvectors which explain the most essence of the data quite accurately.
Community detection2 is a different approach towards identifying patterns in the data, and the algorithms for detecting communities, such as Girvan Newman Algorithm, are usually used. However, due to the high time complexity of the algorithm (E: Edges, N: Nodes), community detection was not possible on the dataset due to computational limitations.
Regression models are the most intuitive models in Machine Learning, and it is easy to add and drop features, using Ridge and Lasso regularization terms3.
The following were the models/methods attempted in the project:
-
Regression: Linear, Ridge, Lasso
-
Spectral clustering: with and without eigenvalue/eigenvector decomposition
-
Degree centrality computation4
-
Clustering coefficient calculation
-
Community detection: Girvan Newman algorithm (Failed to implement)
The experiment provided insights about products which possessed higher centrality tendencies, and these measures can be used successfully in marketing5, for methods like influencer products, pyramid marketing, etc.
Methodology
A) Pre-processing:
The data was in the form of a text, with both nodes/connections, as well as text data which signified the purpose of the product. Steps: I) Strip ID, ASIN (nodes), Title, Group, Salesrank, Similar products (connections), Categories, Reviews
II) Remove the stopwords from the Categories, and cleaned the text
III) Split the data by Group (DVD, Music, Video, Audio), and then combined them. Verified the original count with the concatenated lists count
IV) Strip the words in the categories of both the product, as well as the similar product. Depending upon how many words are similar in both the cases, the similarity is calculated by:
V) Calculate degree centrality using the following formula:
Once the above stated variables were calculated, they were all appended to a dictionary.
Following are the visualizations for the attributes:
- Average Rating:
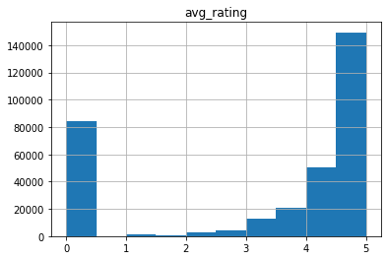
The average ratings for all the products given as 0 were removed when conducting the regression model, with the assumption that those were the cases when no rating was found, which are outliers for the data.
- Degree Centrality:
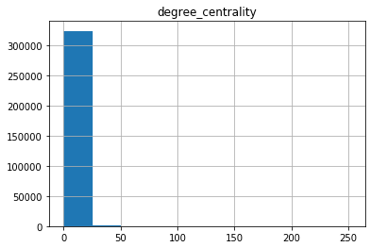
It is clearly visible that extremely less number of nodes have higher than 0 degree centrality, which means that these nodes are more centred as compared to most of the products.
These are the kind of products that we marketing department need to look out for, because they have the potential to be an influencer or a catalyst product. Other associations are likely because other products are an accessory, or necessary requirement of the product’s functioning.
- Clustering Coefficient:
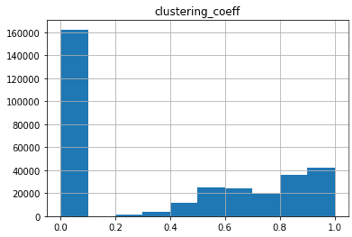
A lot of products in the amazon co-purchase dataset have a clustering coefficient higher than 0.2 (judging by the area under the curve, almost 1/6th products), Depending on the clustering coefficient, priority queue for marketing/sales and advertising of products can be built, which is necessary to improve engagements via inorganic growth.
B) Regression Models:
To build a regression model, the following attributes were shortlisted: I) Average rating
II) Total reviews
III) Degree centrality
IV) Clustering coefficient
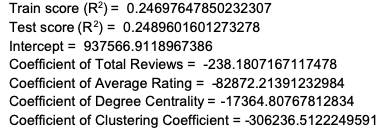
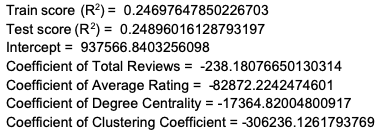
The regression model is built to predict the Sales Rank (lower rank implies higher sales). Naturally, it is expected that the coefficients are negative, because as the features’ values increase, the model must output a lower rank.
Regularization methods were explored (Lasso and Ridge Regression) to add/subtract features to improve the model’s performance. It is necessary to note that adding features might lead to a decrease in performance too.
C) Dimensionality Reduction:
Due to computational limitations, both NetworkX and Scipy do not support the calculation of all the eigenvectors and eigenvalues in the Laplacian Matrix6. Therefore, the method implemented was to compute the top k-eigenvalues/eigenvectors. The experiment was conducted till k=200, but for K > 200, memory error was noticed.
K-means clustering was conducted on 200 eigenvectors, and as expected, most of the elements were clustered to one single group, as the number of books are much higher than number of music, DVDs, and video products.
Results
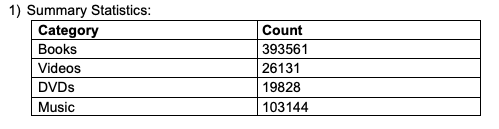
A) Summary Statistics:
B) Regression Models:
I) Linear Regression:
II) Ridge Regression:
III) Lasso Regression:
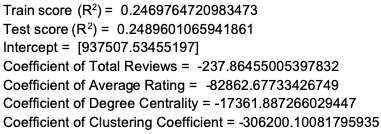
The experiment showed that increase in the value of regularization term is causing a decrease in the R2 value.
Less regularization: 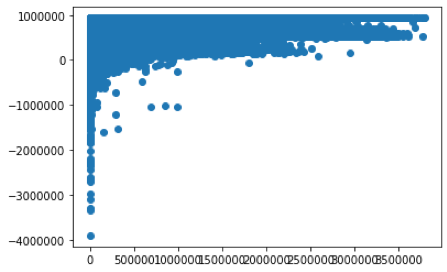
More regularization: 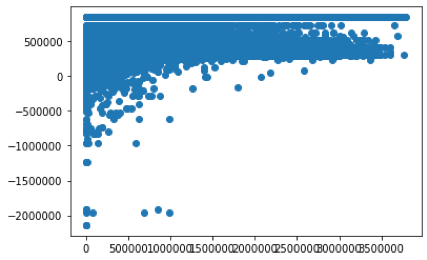
Products with highest clustering coefficient:
Products with highest degree centrality:
Conclusion
The key conclusions of the experiment are as follows:
a) Traditional machine learning algorithms, which take into consideration the probability density estimation, fail to perform well in networks.
b) Degree centrality and clustering coefficient are good metrics to measure the popularity of a product.
c) Community detection algorithms are computationally expensive, however, with the proper infrastructure, can be the basis of recommender systems.
Check out the code here.